
Posted November 06, 2025

By Sean Ring
The Start of the Metals Rebound?
It’s been a rough few weeks for gold, silver, and miner investors. I know… I’m one of them.
If you’ve been following the Rude for a while, you’ll know we got in a year ago and are still sitting on significant gains. Those gains just aren’t as huge as they were.
I’ve always said we were going to see corrections sooner or later, and it wouldn’t feel good. And boy, it hasn’t. But I didn’t want to buy in and sell out because timing the waves is exceedingly tricky.
So while I’m still bullish on the metals and miners, I absolutely understand why you may be thinking, “When is this going to end?”
The good news is the metals and miners may be coiling for their next leap.
Macro Reasons
Gold and silver may rebound this November, and some reasons are unmistakably macro.
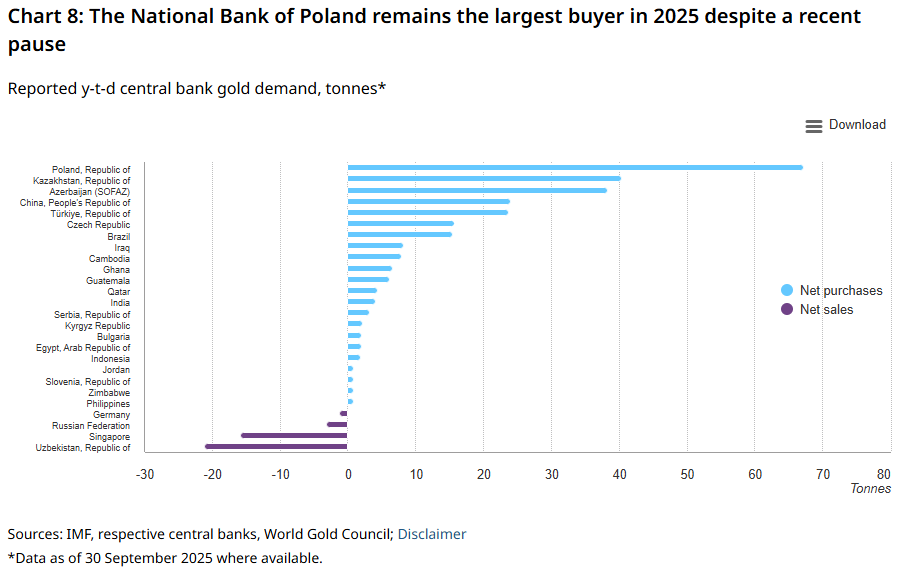
First, central banks—led by Russia—are hoarding metal like it’s going out of style. Moscow even added silver to its reserves as part of its de-dollarization drive, helping establish a new floor near $4,000 for gold and $48 for silver.
One country I didn’t have on my Bingo card was Poland. Although Poland is a member of the European Union, it doesn’t use the euro; instead, it retains its native currency, the zloty. Yet, Poland has bought the most gold of any country this year. The National Bank of Poland seeks to increase its gold reserves to 30% of its total allocation, up from the current 24%. This move aims to lower its geopolitical risk, particularly in light of the Russia-Ukraine War, and to enhance its financial independence.
The Fed’s recent 25-basis point rate cuts in September and October have lowered real yields. One more cut in December may prompt investors to rush toward hard assets.
Finally, physical supply remains tight while industrial demand for silver in green tech and electronics continues to surge.
With central banks diversifying out of dollars and miners struggling to keep up, the macro backdrop couldn’t be more supportive for a sustained metals rally.
Political Reasons
Then there’s the political powder keg driving the fear trade.
To start, ongoing chaos in the Middle East, renewed U.S.–China tariff volleys, and Moscow’s financial maneuvers have all revived the role of gold and silver as geopolitical insurance.
Next, the longest U.S. government shutdown in modern history—and with it, fresh doubts about Washington’s fiscal sanity—and you get a potent mix of fear and distrust in fiat.
China’s new export taxes on gold and silver, coupled with Russia’s explicit shift away from dollar-based trade, demonstrate that precious metals are now strategic assets in global policy, not just commodities.
In short, the world’s political class has handed bullion investors a perfect storm of uncertainty—and they’re buying accordingly.
Technical (Chart) Reasons
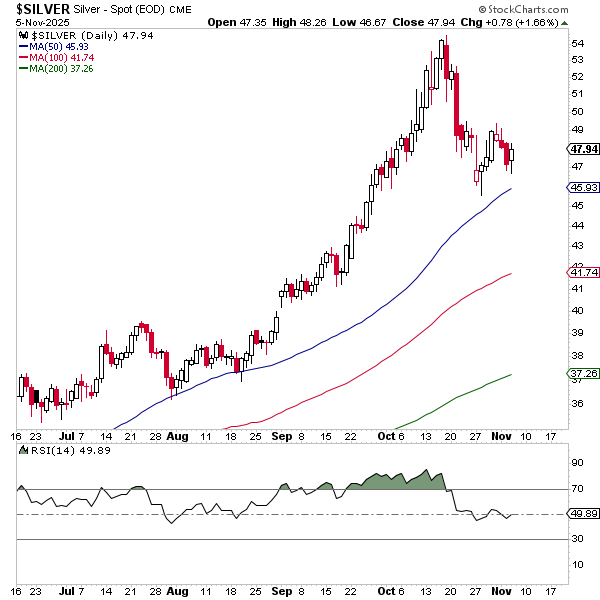
First, let’s look at the charts. But before we do, take note: I’ve added the 100-day moving average into the chart (red line), along with the 50-day MA (blue line) and the 200-day MA (green line). Beneath the price chart, I added the Relative Strength Indicator (RSI).
The RSI is a momentum oscillator that measures the speed and size of an asset’s recent price changes to identify overbought or oversold market conditions.
It helps traders identify potential trend reversals, divergences, and signals for buying or selling, especially when used in conjunction with other indicators and within the context of prevailing market trends.
RSI values range from 0 to 100. Traditionally, traders consider an RSI above 70 to be overbought, while an RSI below 30 is considered oversold.
Also consider what my friend and colleague Enrique Abeyta says. Charts correct by both price and time. In this case, just because we’ve had a significant price correction doesn’t mean it won’t take more time for the market to digest the move. In short, we may not be out of the woods yet.

Regarding gold, we can observe the candles (prices) detaching completely from the moving averages before violently moving down to reunite with them. And yet, gold prices are still above their 50-day MA, showing just how strong that upthrust was.
Also note the RSI was showing an “overbought signal” (the green shade on the bottom chart) for about six weeks before prices crashed. Now we’re about in the middle. So gold is neither overbought nor oversold at the moment.
Silver’s chart shows something similar.
Now, let’s look at some miner positions in the unofficial Rude portfolio.
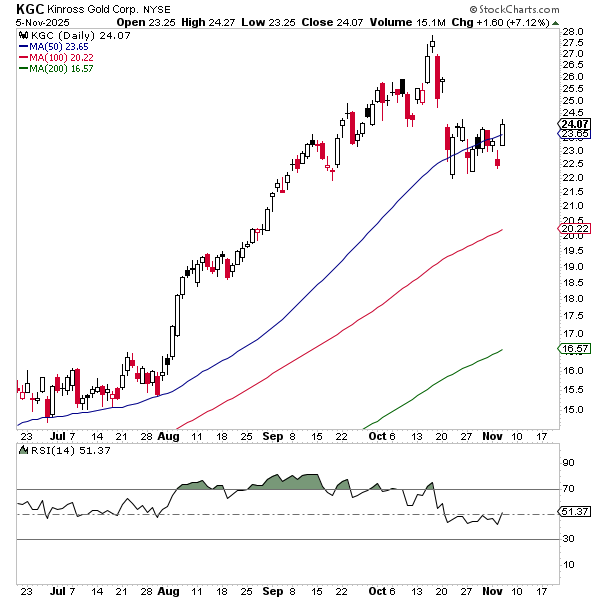
KGC has already hit its 50-day MA. Interestingly, it rallied over 7% yesterday after missing some Q3 estimates. From finimize:
Kinross Gold’s latest results were a mixed bag: adjusted earnings per share landed at $0.44, beating RBC and analyst expectations of $0.40, thanks in part to lower taxes, although revenue was a bit softer. Meanwhile, free cash flow missed the mark at $642 million, trailing forecasts closer to $670 million.
KGC has consolidated and will soon close the gap between $24 and $25. From there, it should get over its recent closing high of $27.58.
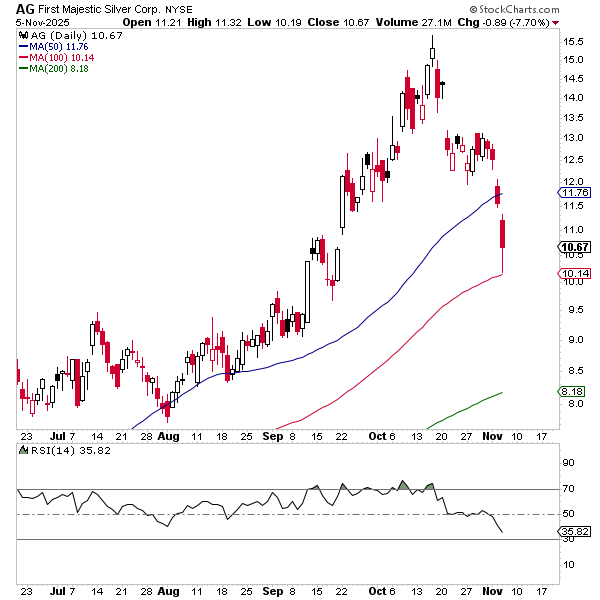
First Majestic isn’t quite oversold yet, but it’s starting to look like the market overreacted. Yesterday, the price bounced off the 100-day MA. Let’s see if it can stay above this level. It’s already reached its downside price target of $11.03.
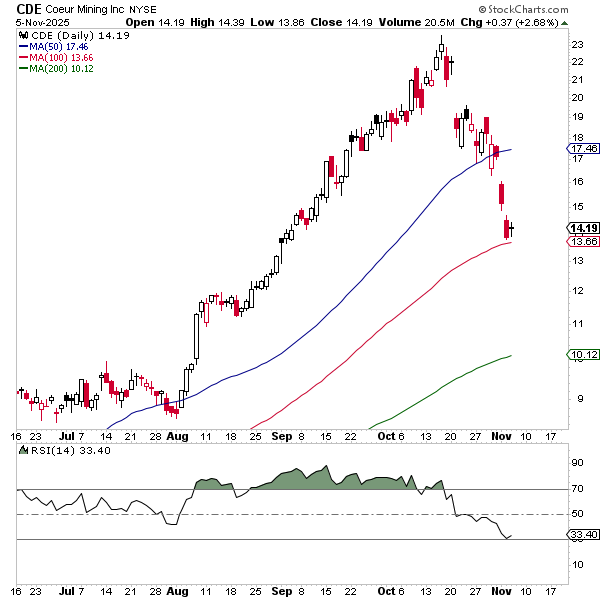
Coeur looks much the same as AG, but it’s getting awfully close to being oversold. I look forward to it closing that gap between $20 and $21, but that may take longer with CDE buying New Gold.
Wrap Up
There are good macro, political, and technical reasons for the metals and miners rally to resume.
It may not happen today or tomorrow, but it will eventually, and probably before the end of the year.
Keep calm and carry on.

Cheney’s Legacy Is All Around You
Posted November 05, 2025
By Sean Ring

The Socialist Sandbox
Posted November 04, 2025
By Sean Ring

The Joyless Bull
Posted November 03, 2025
By Sean Ring

Go Big. Go Homer.
Posted October 31, 2025
By Sean Ring

Powell Cuts, Then Waffles
Posted October 30, 2025
By Sean Ring