Posted September 01, 2026

By Sean Ring
Sell Promises, Buy Things
August was not a risk-on month so much as a duration-off month. The dividing line across the table wasn't between equities and bonds or between safety and speculation; it was between claims on real things and promises for fixed nominal payments.
We saw gold and silver have their sharpest advances of the year. Crude extended a quarter that has repriced the entire inflation path. Copper firmed. And, finally, mercifully for Michael Saylor, crypto rose from the dead after an awful first half.
Against that, long Treasuries and investment-grade credit only managed a wee bounce inside a downtrend, and REITs were the month's clearest loser.
But here’s the thing: 10-year yields moved higher after the market rejected Bessent’s strategy and after hearing Warsh on Friday. At the same time, the dollar drifted lower. That combination isn’t a growth story. Growth differentials would lift the currency. It’s a term premium and debasement story, and everything that worked in August worked for the same reason.
Let’s get to the charts.
S&P 500
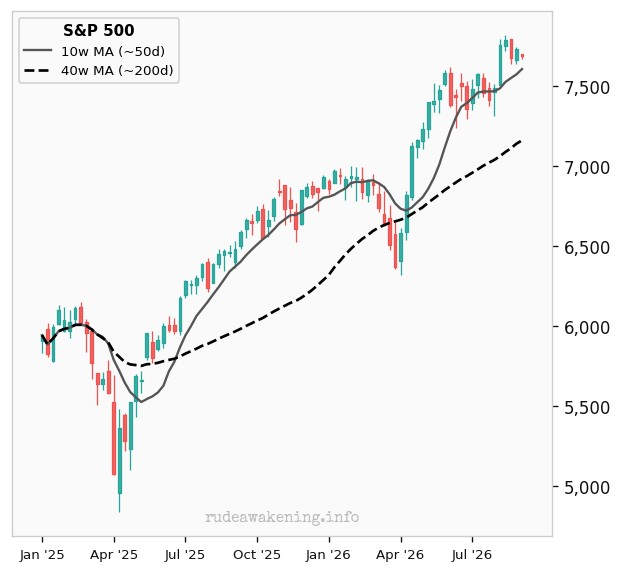
| July Close | 7,489.72 | Month-to-Date | +2.6% |
| August Close | 7,686.14 | Quarter-to-Date | +2.5% |
| Trend | Bullish | Year-to-Date | +12.3% |
The index is absorbing a rising discount rate by relying entirely on nominal (before inflation) earnings growth, which an inflating economy is happily supplying. That works for now. But when the term premium rises faster than revenue growth, watch out below!
Headline calm is masking meaningful rotation beneath the surface. The internals look far less serene than the level suggests.
The upside target is 10,465, implying a 35% up move from here. But will it be real, or just inflation?
Nasdaq Composite
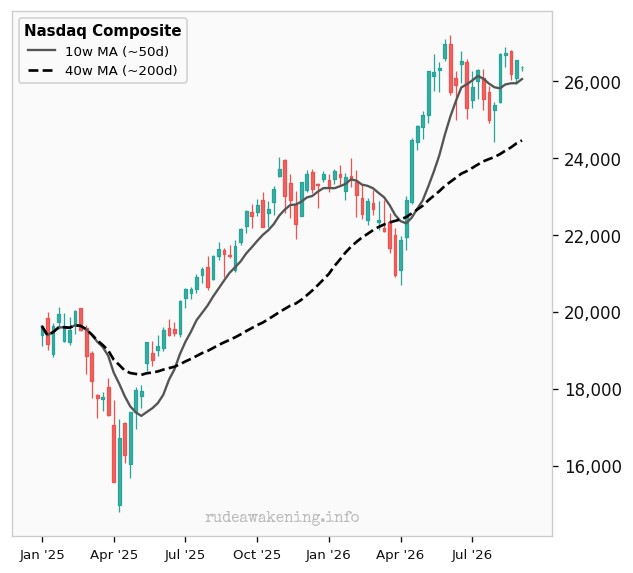
| July Close | 25,374 | Month-to-Date | +3.9% |
| August Close | 26,371 | Quarter-to-Date | +0.6% |
| Trend | Bullish | Year-to-Date | +13.5% |
A great August repaired the July damage. But that’s it. We’re still bullish according to the charts. But we’ve got the overblown AI bubble ready to pop. Will we get to the ludicrous upside target of 43,404, or was that all earnings smoke? I bet the latter.
Russell 2000
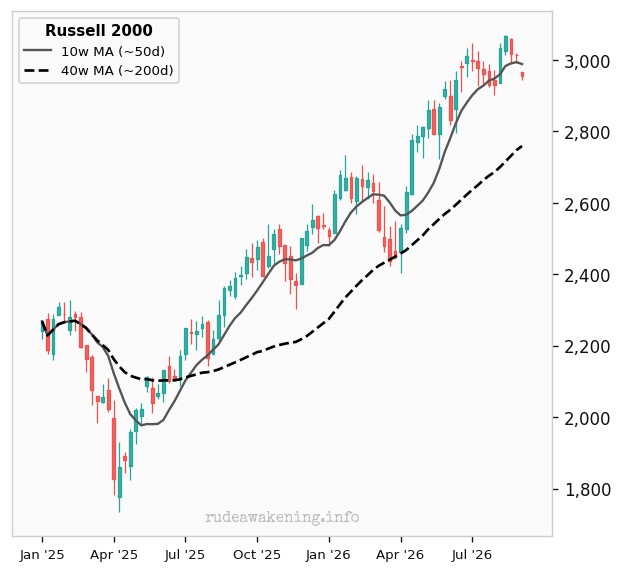
| July Close | 2,931.34 | Month-to-Date | +0.9% |
| August Close | 2,956.45 | Quarter-to-Date | -2.2% |
| Trend | Caut. Bullish | Year-to-Date | +19.1% |
Small caps still lead on the year yet trail badly this quarter. The group frontran an easing cycle the rates market refuses to confirm. With floating rate debt loads, the Russell trades more like a levered short on the 10-year right now, rather than a bet on the domestic economy.
The first upside target of 3,212 is doable. But the second, at 4,081, is a pipe dream for now.
US 10-Year Yield
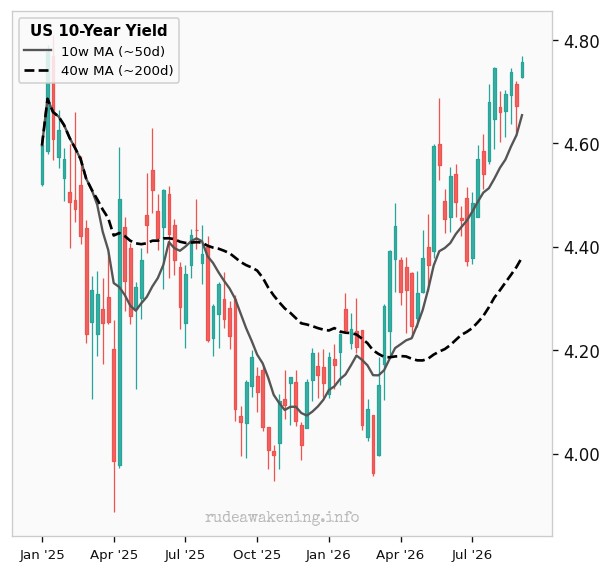
| July Close | 4.74% | Month-to-Date | +0.3% |
| August Close | 4.76% | Quarter-to-Date | +7.7% |
| Trend | Bullish | Year-to-Date | +14.3% |
I wrote enough about Bessent’s move. And I was right in that Warsh didn’t fall in line; he’s far more worried about inflation than his boss. So here we are: a high 10-year yield that’s rising further.
And yields rising higher in a quarter when oil rose more than 20% confirms this isn’t growth optimism. The fact that this happened alongside a softening dollar (below) demonstrates the market is demanding a higher return for its risk. Every other item in this report, like REITs, small caps, and gold, is downstream of this number.
An upside target of 4.96% will surely be hit. The bigger target of 5.16% will take a bit longer.
US Dollar (DXY)
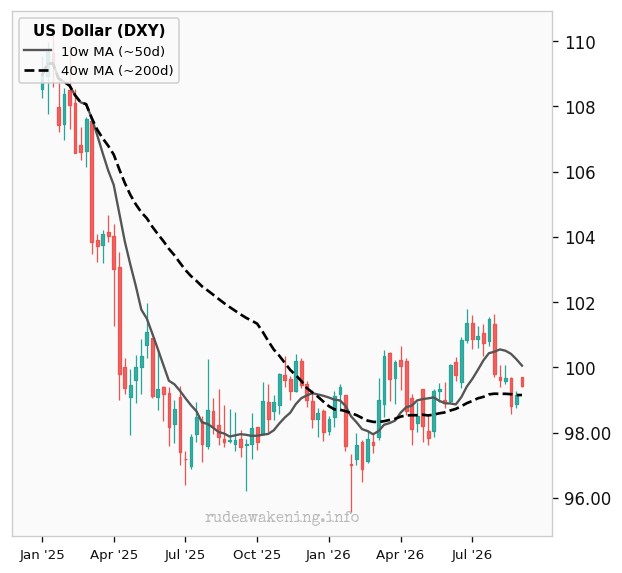
| July Close | 99.80 | Month-to-Date | -0.4% |
| August Close | 99.43 | Quarter-to-Date | -1.7% |
| Trend | Caut. Bullish | Year-to-Date | +1.2% |
The world doesn’t want dollars. It needs them. And when the world can be rid of them, it will be.
Until then, the dollar remains the world’s reserve currency.
But it’s a currency that isn’t rallying while its yields rise. That tells us something about who is being asked to fund the deficit and at what price. Dollar softness is the common thread beneath the strength in gold, copper and crypto this month.
We still have an upside target of 109.76. But that’s clearly in jeopardy.
TLT (20Y Bond)
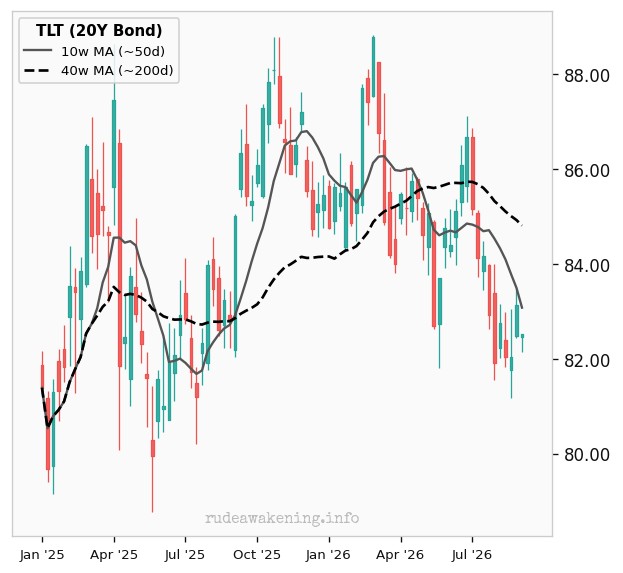
| July Close | 81.92 | Month-to-Date | +0.7% |
| August Close | 82.52 | Quarter-to-Date | -3.8% |
| Trend | Bearish | Year-to-Date | -2.8% |
A small monthly gain for bonds inside a persistent downtrend is about the coupon, not a turn in fortunes. Supply and the term premium set the price now, and neither responds to soft landing narratives. Buyers here are getting paid a decent coupon to be wrong about direction. In short, bond prices will fluctuate, but at least your higher coupon won’t.
The next downside target is an eye-watering 70.41, implying a nearly 15% down move.
LQD (IG Corp)
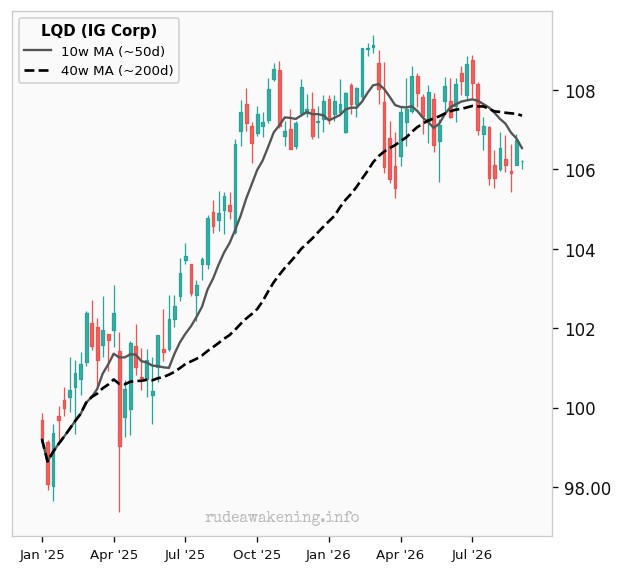
| July Close | 105.79 | Month-to-Date | +0.4% |
| August Close | 106.21 | Quarter-to-Date | -1.9% |
| Trend | Bearish | Year-to-Date | -1.0% |
Investment grade is duration wearing a credit costume. At times like these, people who own LQD as a conservative sleeve discover it’s a position on interest rates. Until the long end stabilizes, the income is the return story. The long-term downside target is 99.83.
HYG (High Yield)
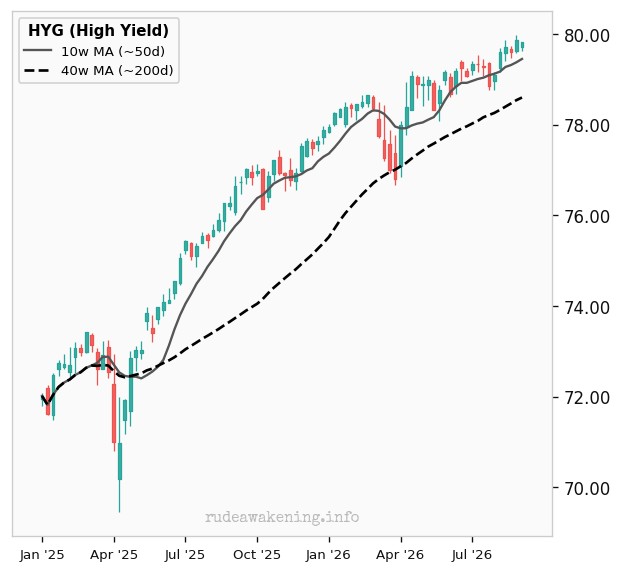
| July Close | 79.10 | Month-to-Date | +0.9% |
| August Close | 79.81 | Quarter-to-Date | +0.7% |
| Trend | Bullish | Year-to-Date | +2.5% |
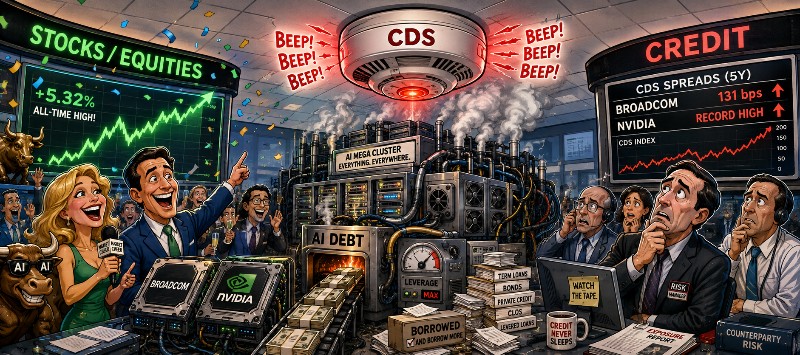
Why not own junk when the Fed will always bail you out? You get higher coupons with little additional risk. Still, it’s also the strongest argument against the recession narrative implied by small-cap weakness (above). The bond sector isn’t confirming equity-market anxiety, and credit usually knows first. (See yesterday’s piece on CDSs.)
If spreads start widening in concert with the Russell, that is the signal to reduce risk across the board. For now, the next upside target is 89.01.
VNQ (Real Estate)
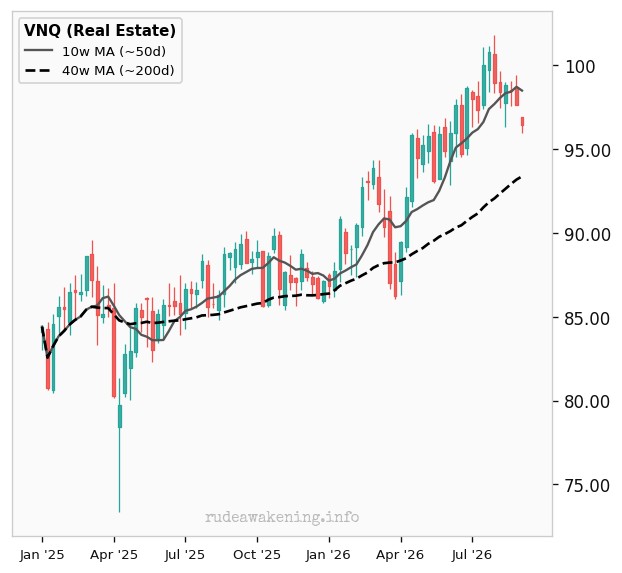
| July Close | 98.95 | Month-to-Date | -2.5% |
| August Close | 96.44 | Quarter-to-Date | +0.0% |
| Trend | Caut. Bullish | Year-to-Date | +11.1% |
REITs are the cleanest listed expression of long-duration cash flow, and they were the month's designated victim. Cap rates reprice mechanically off the 10-year yield, and rent growth can’t outrun a mid-4% discount rate. That this happened while high-yield rallied confirms the pain is in financing costs, not tenant credit… for now.
Still, we have an upside target of 103.38.
WTI Crude Oil
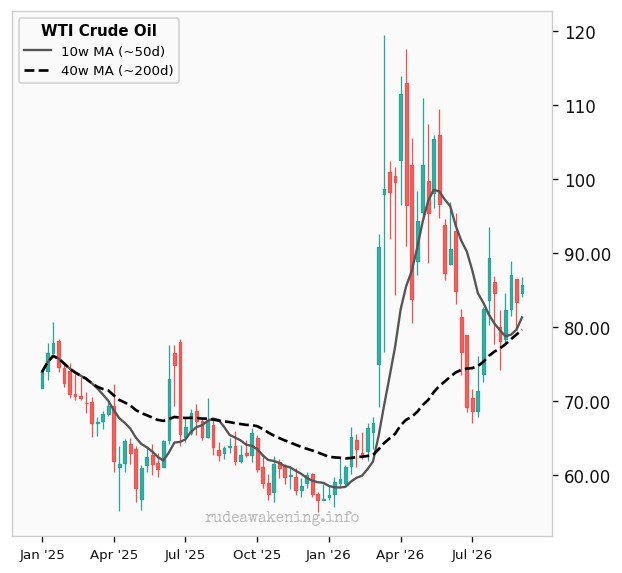
| July Close | 84.67 | Month-to-Date | +1.3% |
| August Close | 85.76 | Quarter-to-Date | +23.4% |
| Trend | Bullish | Year-to-Date | +49.4% |
The year-to-date move in crude is arguably the most important number in this report because it feeds headline inflation with a lag, which then feeds the term premium, which then feeds every valuation in the report. This is a supply-side and geopolitical issue, thanks to the war. That makes it stickier and harder for policy to offset. A Fed pivot and $85 oil aren’t a good mix.
We’ve got mixed targets for crude. It depends on The Donald, for better or worse.
Copper
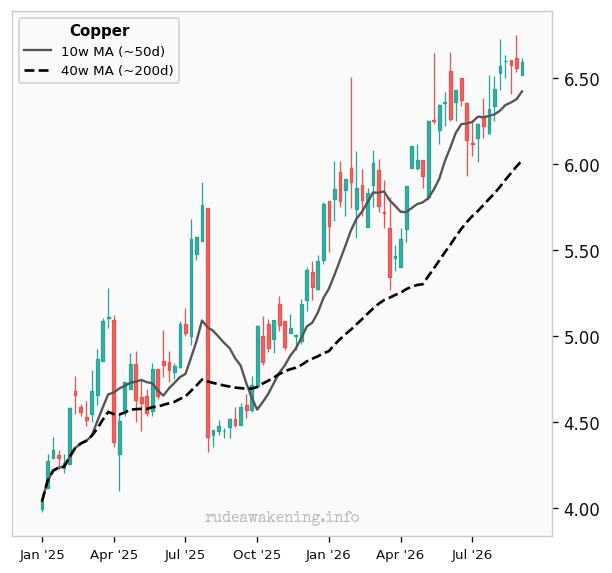
| July Close | 6.44 | Month-to-Date | +2.4% |
| August Close | 6.59 | Quarter-to-Date | +6.5% |
| Trend | Bullish | Year-to-Date | +17.1% |
Copper firming alongside oil looks like a generic commodity bid. Still, the driver is different: grid buildout, data-center electrification, and a mine supply pipeline that can’t respond within the cycle.
The split between strong copper and weak domestic small caps is unusual and instructive. Global industrial demand is fine, while rate-sensitive domestic balance sheets aren’t. Treat copper strength as an inflation input, not as an all-clear for growth.
The immediate, hittable target is 6.82. The next big upside target is 8.54.
Gold
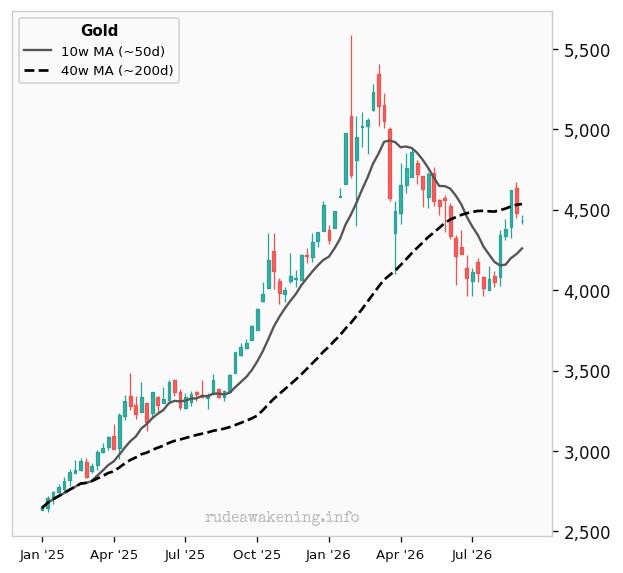
| July Close | 4,049.10 | Month-to-Date | +9.4% |
| August Close | 4,431.10 | Quarter-to-Date | +10.1% |
| Trend | Caut. Bearish | Year-to-Date | +2.4% |
Gold advancing while nominal and real yields rise is nakedly debasement. The rebound comes off a genuine drawdown, and the longer-term average still sits overhead as a reminder that even structural bull markets need to digest. Central bank and reserve-diversification demand remains the floor under every correction.
We have no immediate targets for gold.
Silver
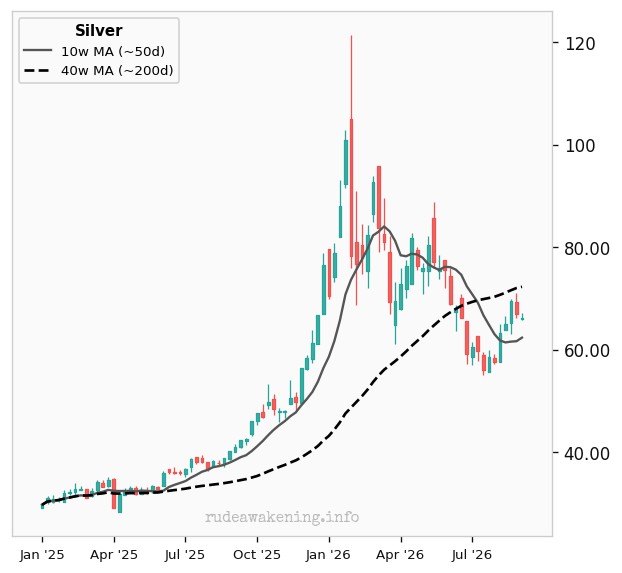
| July Close | 57.59 | Month-to-Date | +15.0% |
| August Close | 66.22 | Quarter-to-Date | +11.3% |
| Trend | Caut. Bearish | Year-to-Date | -5.6% |
Silver did what silver does: fall harder, then bounce harder. It still sits underwater for the year. The dual industrial/monetary demand profile amplifies both the gold and copper theses simultaneously. Position sizing matters more here than the thesis. Volatility is the cost of greater upside.
Still, we have a medium-term downside target of 54.33 and a long-term downside target of 44.95.
Bitcoin
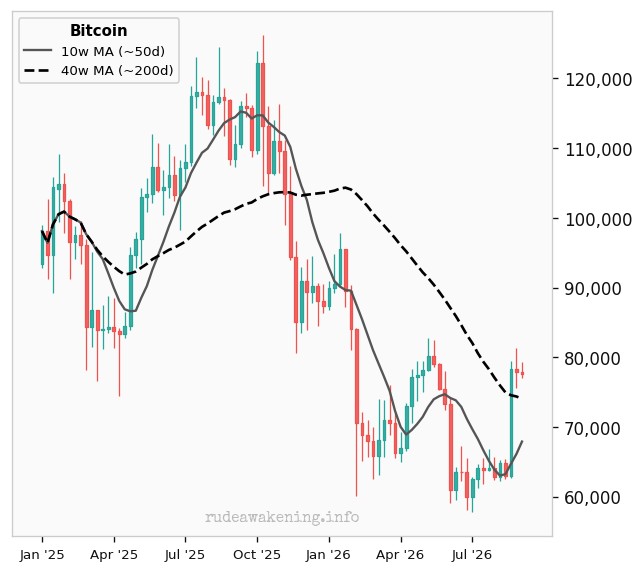
| July Close | 62,814 | Month-to-Date | +23.6% |
| August Close | 77,668 | Quarter-to-Date | +32.6% |
| Trend | Bullish | Year-to-Date | -11.2% |
Reclaiming the longer-term trend after a brutal first half is repair, not renewal. The year-to-date hole is still double digits. BTC behaved this month exactly as a liquidity and dollar-weakness product should, which is a reminder that it’s not the hedge Bitcoin Maxies think it is. The question is whether investor flows follow the price or merely watch it.
We have no immediate targets for BTC.
Ethereum
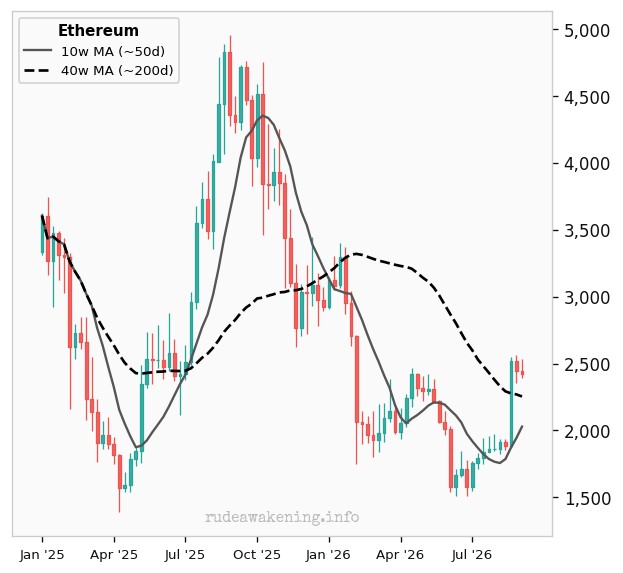
| July Close | 1,860.35 | Month-to-Date | +30.0% |
| August Close | 2,417.94 | Quarter-to-Date | +54.0% |
| Trend | Bullish | Year-to-Date | -18.5% |
Ethereum’s year-to-date damage is more serious than Bitcoin's, meaning this is a lower base recovering faster rather than genuine leadership from the Avis rent-a-car of crypto. Sustainability depends on whether staking and stablecoin activity confirm the price.
We also have no targets for ETH.
Summary: Traditional Asset Classes
| Asset | Price | MTD | QTD | YTD | Trend |
| S&P 500 | 7,686.14 | +2.6% | +2.5% | +12.3% | Bullish |
| Nasdaq Composite | 26,371 | +3.9% | +0.6% | +13.5% | Bullish |
| Russell 2000 | 2,956.45 | +0.9% | -2.2% | +19.1% | Caut. Bullish |
| US 10-Year Yield | 4.76% | +0.3% | +7.7% | +14.3% | Bullish |
| US Dollar (DXY) | 99.43 | -0.4% | -1.7% | +1.2% | Caut. Bullish |
| TLT (20Y Bond) | 82.52 | +0.7% | -3.8% | -2.8% | Bearish |
| LQD (IG Corp) | 106.21 | +0.4% | -1.9% | -1.0% | Bearish |
| HYG (High Yield) | 79.81 | +0.9% | +0.7% | +2.5% | Bullish |
| VNQ (Real Estate) | 96.44 | -2.5% | +0.0% | +11.1% | Caut. Bullish |
| WTI Crude Oil | 85.76 | +1.3% | +23.4% | +49.4% | Bullish |
| Copper | 6.59 | +2.4% | +6.5% | +17.1% | Bullish |
| Gold | 4,431.10 | +9.4% | +10.1% | +2.4% | Caut. Bearish |
| Silver | 66.22 | +15.0% | +11.3% | -5.6% | Caut. Bearish |
Summary: Crypto
| Asset | Price | MTD | QTD | YTD | Trend |
| Monero | 486.08 | +35.6% | +60.4% | +12.2% | Bullish |
| Ethereum | 2,417.94 | +30.0% | +54.0% | -18.5% | Bullish |
| Ripple (XRP) | 1.36 | +28.2% | +30.9% | -26.1% | Bullish |
| Bitcoin | 77,668 | +23.6% | +32.6% | -11.2% | Bullish |
| Dogecoin | 0.0821 | +18.1% | +14.0% | -30.0% | Caut. Bearish |
| Litecoin | 47.91 | +8.3% | +14.4% | -37.6% | Caut. Bearish |
Wrap Up
Read as a whole, the table describes a nominal-growth, weak-currency regime rather than a risk-on one. Assets with claims on real output, such as energy, industrial metals, precious metals, and, in its own peculiar way, crypto, were bid.
Assets promising fixed nominal cash flows, such as long Treasuries, investment-grade bonds, and REITs, were sold off.
Equities sit awkwardly in between, benefiting from revenue growth while paying for it with a rising required return, which is why the indexes are fine, but the small-cap and REIT complex isn’t.
Credit's resilience says this isn’t the start of a recession. The dollar's inability to rally on higher yields says it may be the beginning of something more structural.
The Smoke Detector Is Beeping
Posted August 31, 2026
By Sean Ring
Play the Ball, Not the Referee
Posted August 28, 2026
By Sean Ring

Gentleman’s Price Control
Posted August 27, 2026
By Sean Ring

Second Harbor
Posted August 26, 2026
By Sean Ring
Bessent's Last Stand
Posted August 25, 2026
By Sean Ring