
Posted June 01, 2026

By Sean Ring
Risk-On, Brains-Off
I feel like I’m waiting for Godot’s rug pull, and it seems it’ll never happen. Since we're entering the 4th month of “2 weeks to flatten the Iranians,” I thought by now the economic damage of this war would be evident for all to see.
Sadly, there’s a big difference between being right and being rich. Damn any economic damage and ride the stock wave!
Anyway, ignore my sour grapes and welcome to the May 2026 Monthly Asset Class Report. The S&P 500 gained a whopping +5.1% on the month to close at 7,580.06, holding a wildly bullish technical posture. The dollar strengthened +0.8%, gold shed -1.2% to 4,560.50, crude oil dropped, long-dated Treasuries barely moved, and Bitcoin slipped -3.8% to 73,373.
With 12 of 13 traditional assets in bullish or cautiously bullish trends, the story is constructive, but markets never move in straight lines. The charts that follow identify where the trend is clearly established, where it's being tested, and where the next key levels lie.
Note: Our primary trend filters are the 10-week and 40-week moving averages (roughly equivalent to the 50-day and 200-day moving averages). When the price is above both, the trend is with you. When it's below both, it isn't. Each asset gets a weekly candlestick chart, a stats table, and a short commentary. The summary return tables at the end rank everything by month-to-date performance.
Because our charts are simple, the commentary is a starting point for your thinking, not a substitute for it.
Let’s get to it.
S&P 500
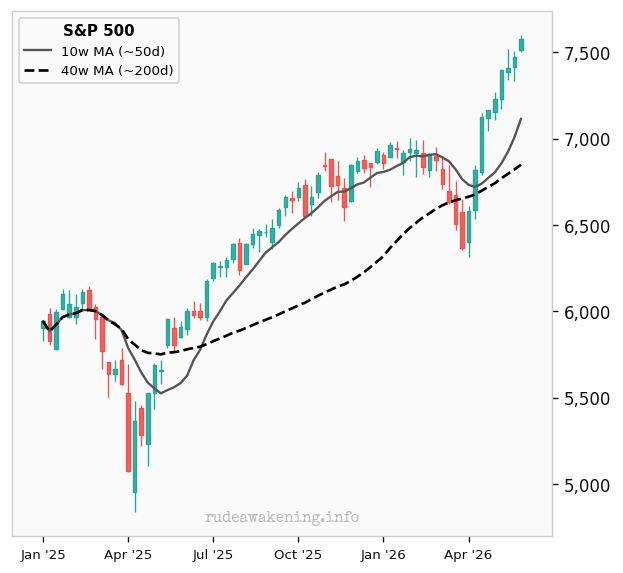
| April Close | 7,209.01 | Month-to-Date | +5.1% |
| May Close | 7,580.06 | Quarter-to-Date | +16.1% |
| Trend | Bullish | Year-to-Date | +10.7% |
The trend structure remains intact with price above both moving averages, but that doesn't mean complacency is warranted. Breadth and sector leadership matter as much as the index level — watch whether cyclicals are leading or whether the advance is narrowing to defensives. The 10-week MA (7,058.17) is the first support to watch on any pullback.
The newly activated daily target is a crazy 10,425, a whopping 37.5% north of here.
Nasdaq Composite
| April Close | 24,892 | Month-to-Date | +8.4% |
| May Close | 26,973 | Quarter-to-Date | +24.9% |
| Trend | Bullish | Year-to-Date | +16.1% |
The Composite holds its trend structure above both moving averages, supported by resilient mega-cap earnings and continued AI infrastructure spend. The risk is concentration — a handful of names driving the headline index masks weakness beneath the surface. The 10-week MA at 24,289 is the line in the sand for trend-followers.
If you thought the S&P 500 target was nuts, try Nasdaq’s: 43,405. That’s 61% away. Insane.
Russell 2000
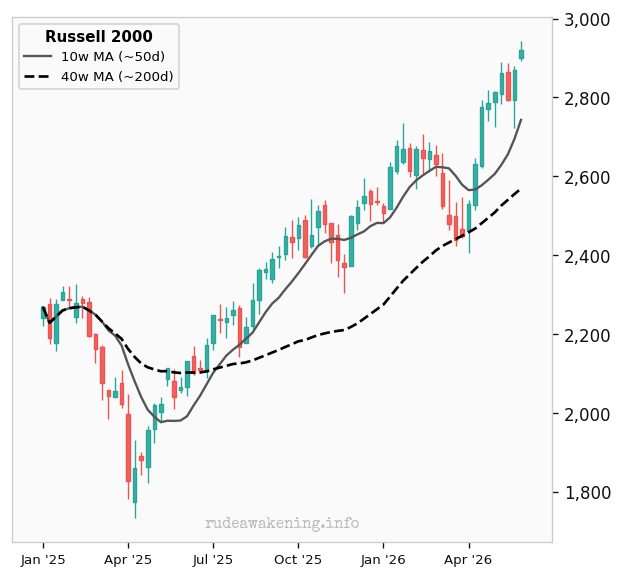
| April Close | 2,799.91 | Month-to-Date | +4.3% |
| May Close | 2,919.34 | Quarter-to-Date | +16.9% |
| Trend | Bullish | Year-to-Date | +17.6% |
Small caps above both moving averages is a healthy sign for the broader market. The Russell 2000 is domestically oriented, so its strength signals confidence in the domestic economy rather than in global mega-cap earnings alone. Watch credit spreads as the companion indicator: tight spreads and a strong Russell 2000 are the risk-on combination.
Again, crazy targets abound. We’re looking at 4,082, a 40% move from here.
US 10-Year Yield
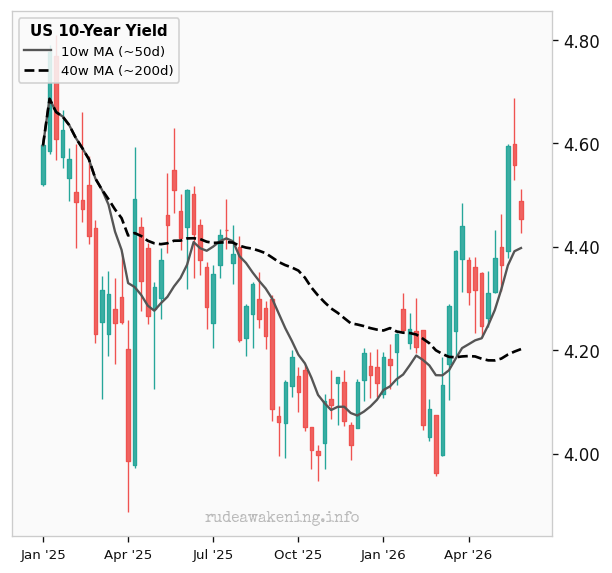
| April Close | 4.39% | Month-to-Date | +1.4% |
| May Close | 4.45% | Quarter-to-Date | +3.3% |
| Trend | Bullish | Year-to-Date | +7.0% |
r this month, reflecting persistent inflation expectations and ongoing fiscal concerns as the term premium continues to rise. Foreign demand for US Treasuries has been inconsistent, which matters when deficits remain large, not to mention a $40 trillion national debt.
At 4.45%, yields are at a level that makes equity valuations increasingly difficult to justify, particularly for long-duration growth stocks. The 4.5% level remains the key psychological threshold.
We’ve still got a 4.96% target, which is why every move Bessent makes is important.
US Dollar (DXY)
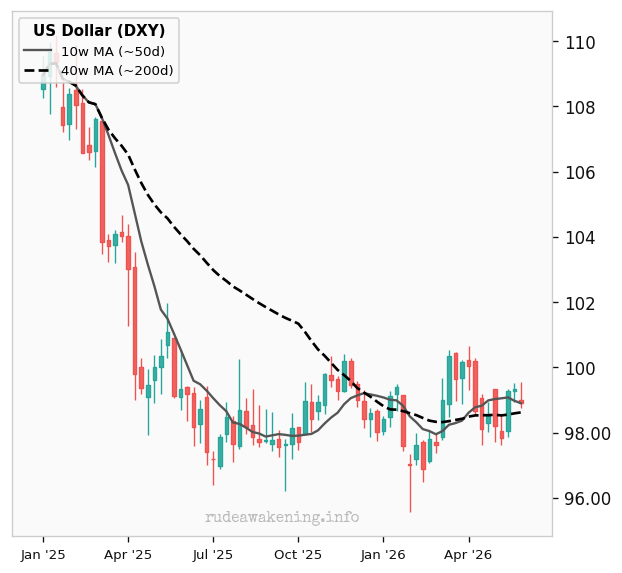
| April Close | 98.08 | Month-to-Date | +0.8% |
| May Close | 98.91 | Quarter-to-Date | -1.1% |
| Trend | Bullish | Year-to-Date | +0.6% |
The dollar's technical strength above both moving averages is a headwind for global risk assets, commodities, and emerging markets. Dollar strength tends to tighten global financial conditions — it's effectively a tax on everyone who borrowed in USD. Watch whether the 40-week MA (98.57) continues to act as support or turns into a level that breaks.
Still a huge downside target of 83.84, but we’ve been going sideways for a year.
TLT (20Y Bond)
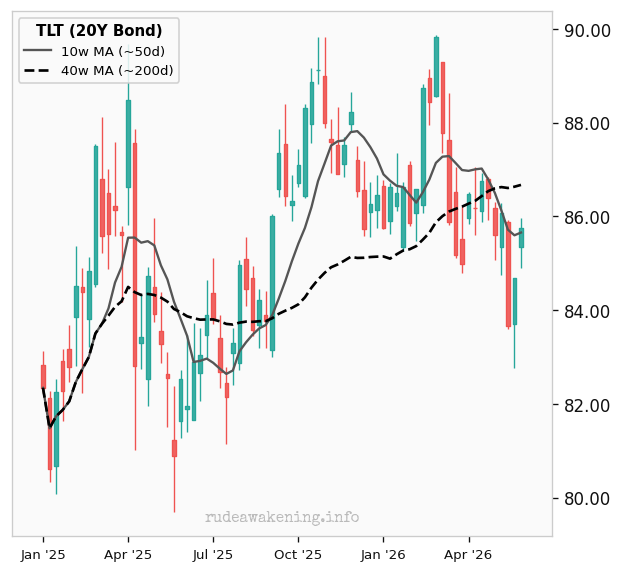
| April Close | 85.31 | Month-to-Date | +0.5% |
| May Close | 85.76 | Quarter-to-Date | -0.3% |
| Trend | Caut. Bearish | Year-to-Date | -0.1% |
Investment-grade credit is holding up. LQD trading above both moving averages suggests the credit market isn’t pricing in meaningful recession risk. Spreads remain tight, which is supportive of the broader risk-on narrative. The risk to this picture is a sharp spike in equity volatility, which tends to force credit spreads to widen regardless of fundamental value.
No targets as yet.
HYG (High Yield)
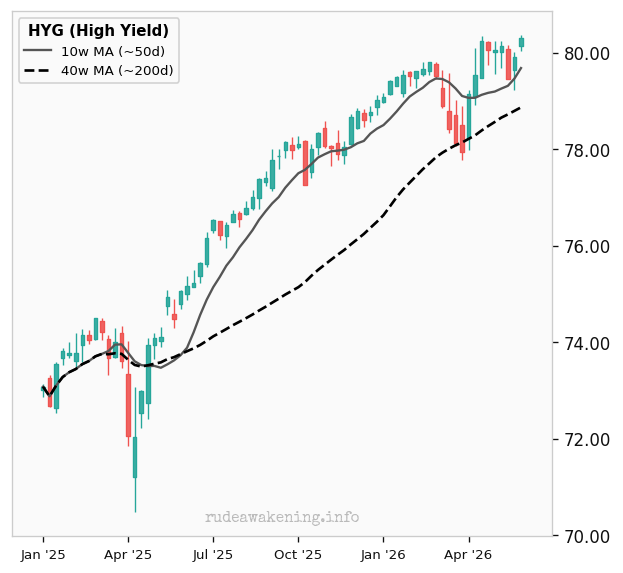
| April Close | 79.96 | Month-to-Date | +0.4% |
| May Close | 80.31 | Quarter-to-Date | +2.0% |
| Trend | Bullish | Year-to-Date | +1.6% |
High yield holds above both moving averages, and tight credit spreads remain one of the strongest arguments against a near-term recession call. The HYG/TLT ratio is a useful risk-on/risk-off indicator — as long as high yield is outperforming long-dated Treasuries, the credit market is not pricing in distress. Watch this relationship closely.
No activated targets for these literal junk bonds.
VNQ (Real Estate)
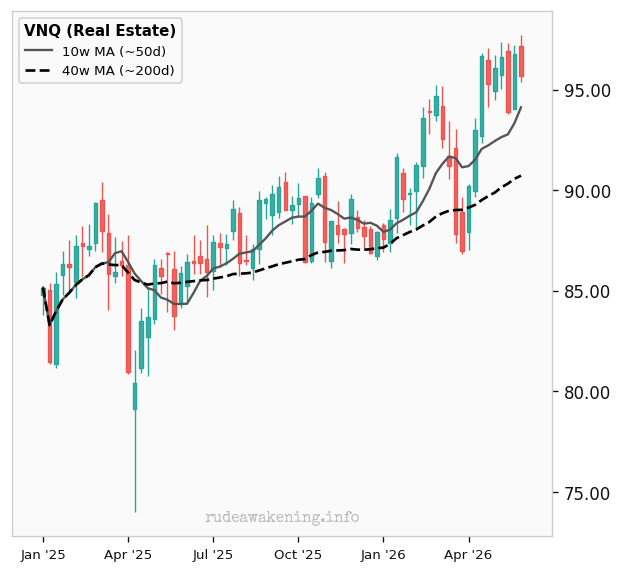
| April Close | 96.33 | Month-to-Date | -0.7% |
| May Close | 95.70 | Quarter-to-Date | +7.9% |
| Trend | Bullish | Year-to-Date | +9.3% |
Unfortunately, residential REITs benefit from persistent housing affordability constraints that keep renters renting. The 10-week MA (93.74) is the key support to watch.
No target as yet.
WTI Crude Oil
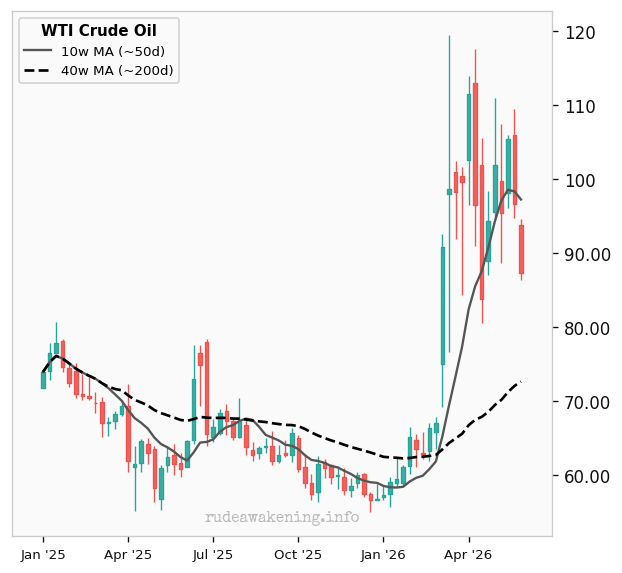
| April Close | 105.07 | Month-to-Date | -16.9% |
| May Close | 87.36 | Quarter-to-Date | -13.8% |
| Trend | Caut. Bullish | Year-to-Date | +52.1% |
Crude oil trading above both moving averages reflects the enormous geopolitical risk premium and a tight supply market. The demand side is the uncertainty. Chinese economic recovery has been slower than hoped, and US growth momentum is the variable to watch.
We had a huge upside target of $177, but have somewhat fallen away from it. Is it peace? Or a delayed offensive?
Copper
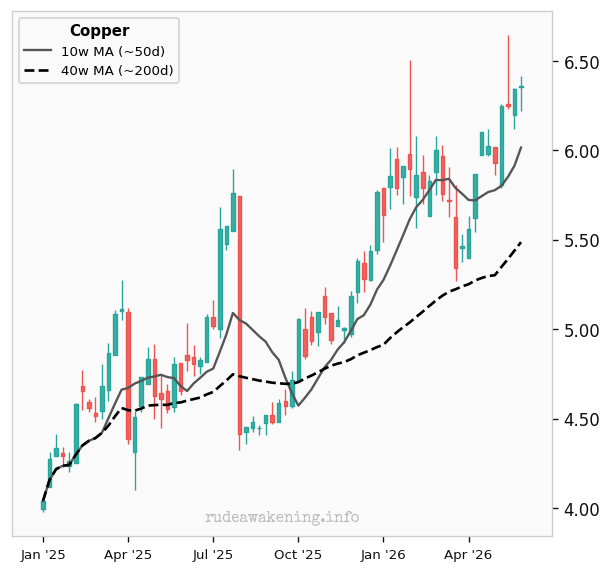
| April Close | 5.93 | Month-to-Date | +7.3% |
| May Close | 6.36 | Quarter-to-Date | +13.8% |
| Trend | Bullish | Year-to-Date | +13.0% |
The electrification and energy transition story — EV batteries, grid infrastructure, data center cooling — provides a structural demand floor that older industrial cycles didn't have. That, and the lack of material for the AI buildout, is what’s keeping copper elevated.
Though the target hasn’t been activated yet, $8.50 doesn’t look as unrealistic as it once did.
Gold
| April Close | 4,614.70 | Month-to-Date | -1.2% |
| May Close | 4,560.50 | Quarter-to-Date | -1.9% |
| Trend | Caut. Bullish | Year-to-Date | +5.4% |
I’m of the opinion that things change once we get above the 50-day moving average again. But right now, the charts are pointing downward. I sympathize with the precious metals bulls, but we just haven’t turned up yet. That’s because central banks, the very institutions that brought us this rally, are selling because of the holes Donald Trump blew through their budgets with this war.
Gold’s downside target is $4,000.
Silver
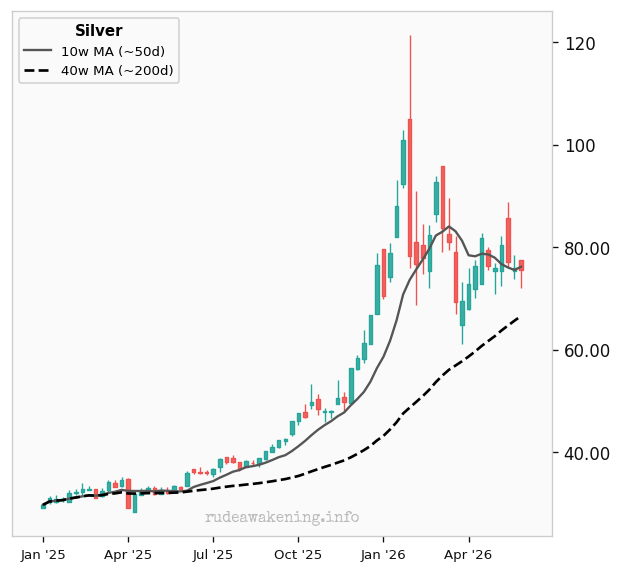
| April Close | 73.53 | Month-to-Date | +2.8% |
| May Close | 75.62 | Quarter-to-Date | +1.2% |
| Trend | Caut. Bullish | Year-to-Date | +7.8% |
Silver historically outperforms gold once it gets into a confirmed uptrend. The gold/silver ratio compression signals industrial demand may be returning alongside investment demand.
We still have downside targets at $64 and $54. I’d prefer to buy back in down there.
Bitcoin
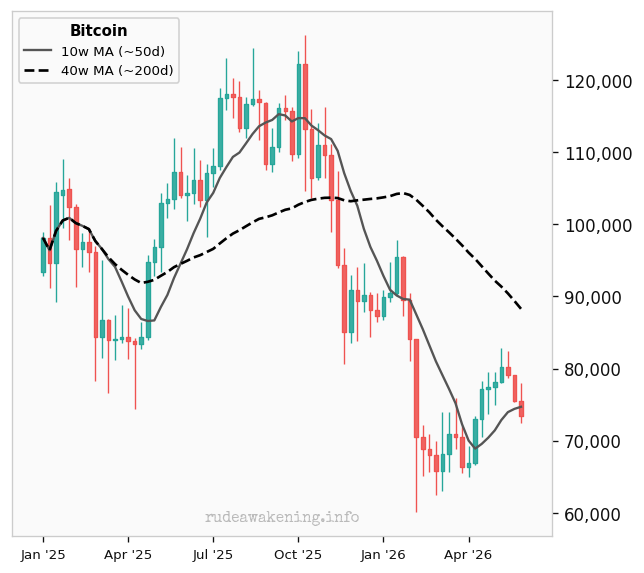
| April Close | 76,304 | Month-to-Date | -3.8% |
| May Close | 73,373 | Quarter-to-Date | +7.5% |
| Trend | Bearish | Year-to-Date | -16.2% |
Bitcoin below both moving averages is the technical definition of a bear market, and in crypto, that means volatility in both directions. The macro tailwinds remain intact as fundamental narratives, but price doesn't care about narratives until the trend confirms.
We still have an old downside target of $54,870, but it’s far from a sure thing that we get there.
Ethereum
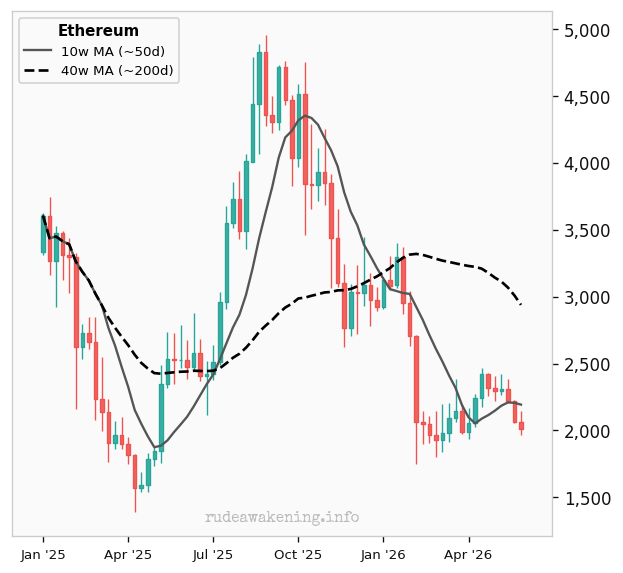
| April Close | 2,256.25 | Month-to-Date | -10.8% |
| May Close | 2,011.98 | Quarter-to-Date | -4.4% |
| Trend | Bearish | Year-to-Date | -32.2% |
Ethereum continues to underperform Bitcoin. I’m not a fan right now.
$1,580 is the next target from here.
Summary: Traditional Asset Classes
| Asset | Price | MTD | QTD | YTD | Trend |
|---|---|---|---|---|---|
| S&P 500 | 7,580.06 | +5.1% | +16.1% | +10.7% | Bullish |
| Nasdaq Composite | 26,973 | +8.4% | +24.9% | +16.1% | Bullish |
| Russell 2000 | 2,919.34 | +4.3% | +16.9% | +17.6% | Bullish |
Summary: Crypto
| Asset | Price | MTD | QTD | YTD | Trend |
| Monero | 397.17 | +4.6% | +19.3% | -8.3% | Bullish |
| Ripple (XRP) | 1.33 | -2.9% | -0.9% | -27.8% | Bearish |
| Bitcoin | 73,373 | -3.8% | +7.5% | -16.2% | Bearish |
| Litecoin | 51.83 | -6.1% | -3.9% | -32.5% | Bearish |
| Dogecoin | 0.0996 | -6.4% | +8.1% | -15.1% | Bearish |
| Ethereum | 2,011.98 | -10.8% | -4.4% | -32.2% | Bearish |
Wrap Up
May 2026 is in the books. The best-performing traditional asset was Nasdaq Composite (+8.4%); the worst was WTI Crude Oil (-16.9%). And during a war in the Middle East, too! Bitcoin lagged equities, losing -3.8% on the month.
The key cross-asset theme was correlation in the right direction: equities and bonds rose together, which is typical of a genuine risk-on, growth-positive environment. That's the benign reading. The less benign reading is that the bond market isn't being given credit as a safe haven.
The dollar was broadly rangebound this month (+0.8%), providing neither a tailwind nor a headwind for commodity prices. Currency wasn’t the story this month.
With 12 of 13 traditional assets in bullish trends, the backdrop is as constructive as it's been in some time. Trend-followers have clear setups. The primary risk is a sharp reversal in sentiment if macro surprises continue to disappoint. (I’m looking at you, inflation!)
Stay with the trend, but tighten stops as positions mature.

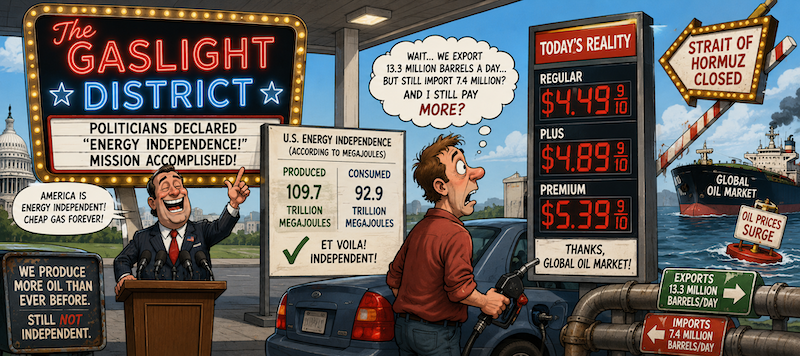
Powered by Oil, Governed by Idiots
Posted May 29, 2026
By Sean Ring
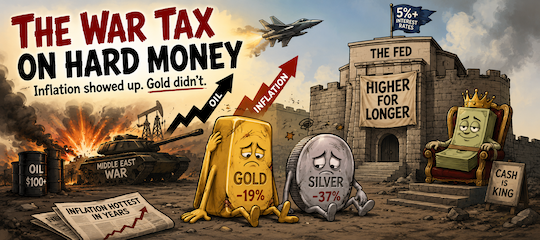
The War Tax on Hard Money
Posted May 28, 2026
By Sean Ring

Mamma Mia, Maranello!
Posted May 27, 2026
By Sean Ring
Pump Fiction
Posted May 26, 2026
By Matt Badiali

The Knowledge Problem
Posted May 25, 2026
By Sean Ring